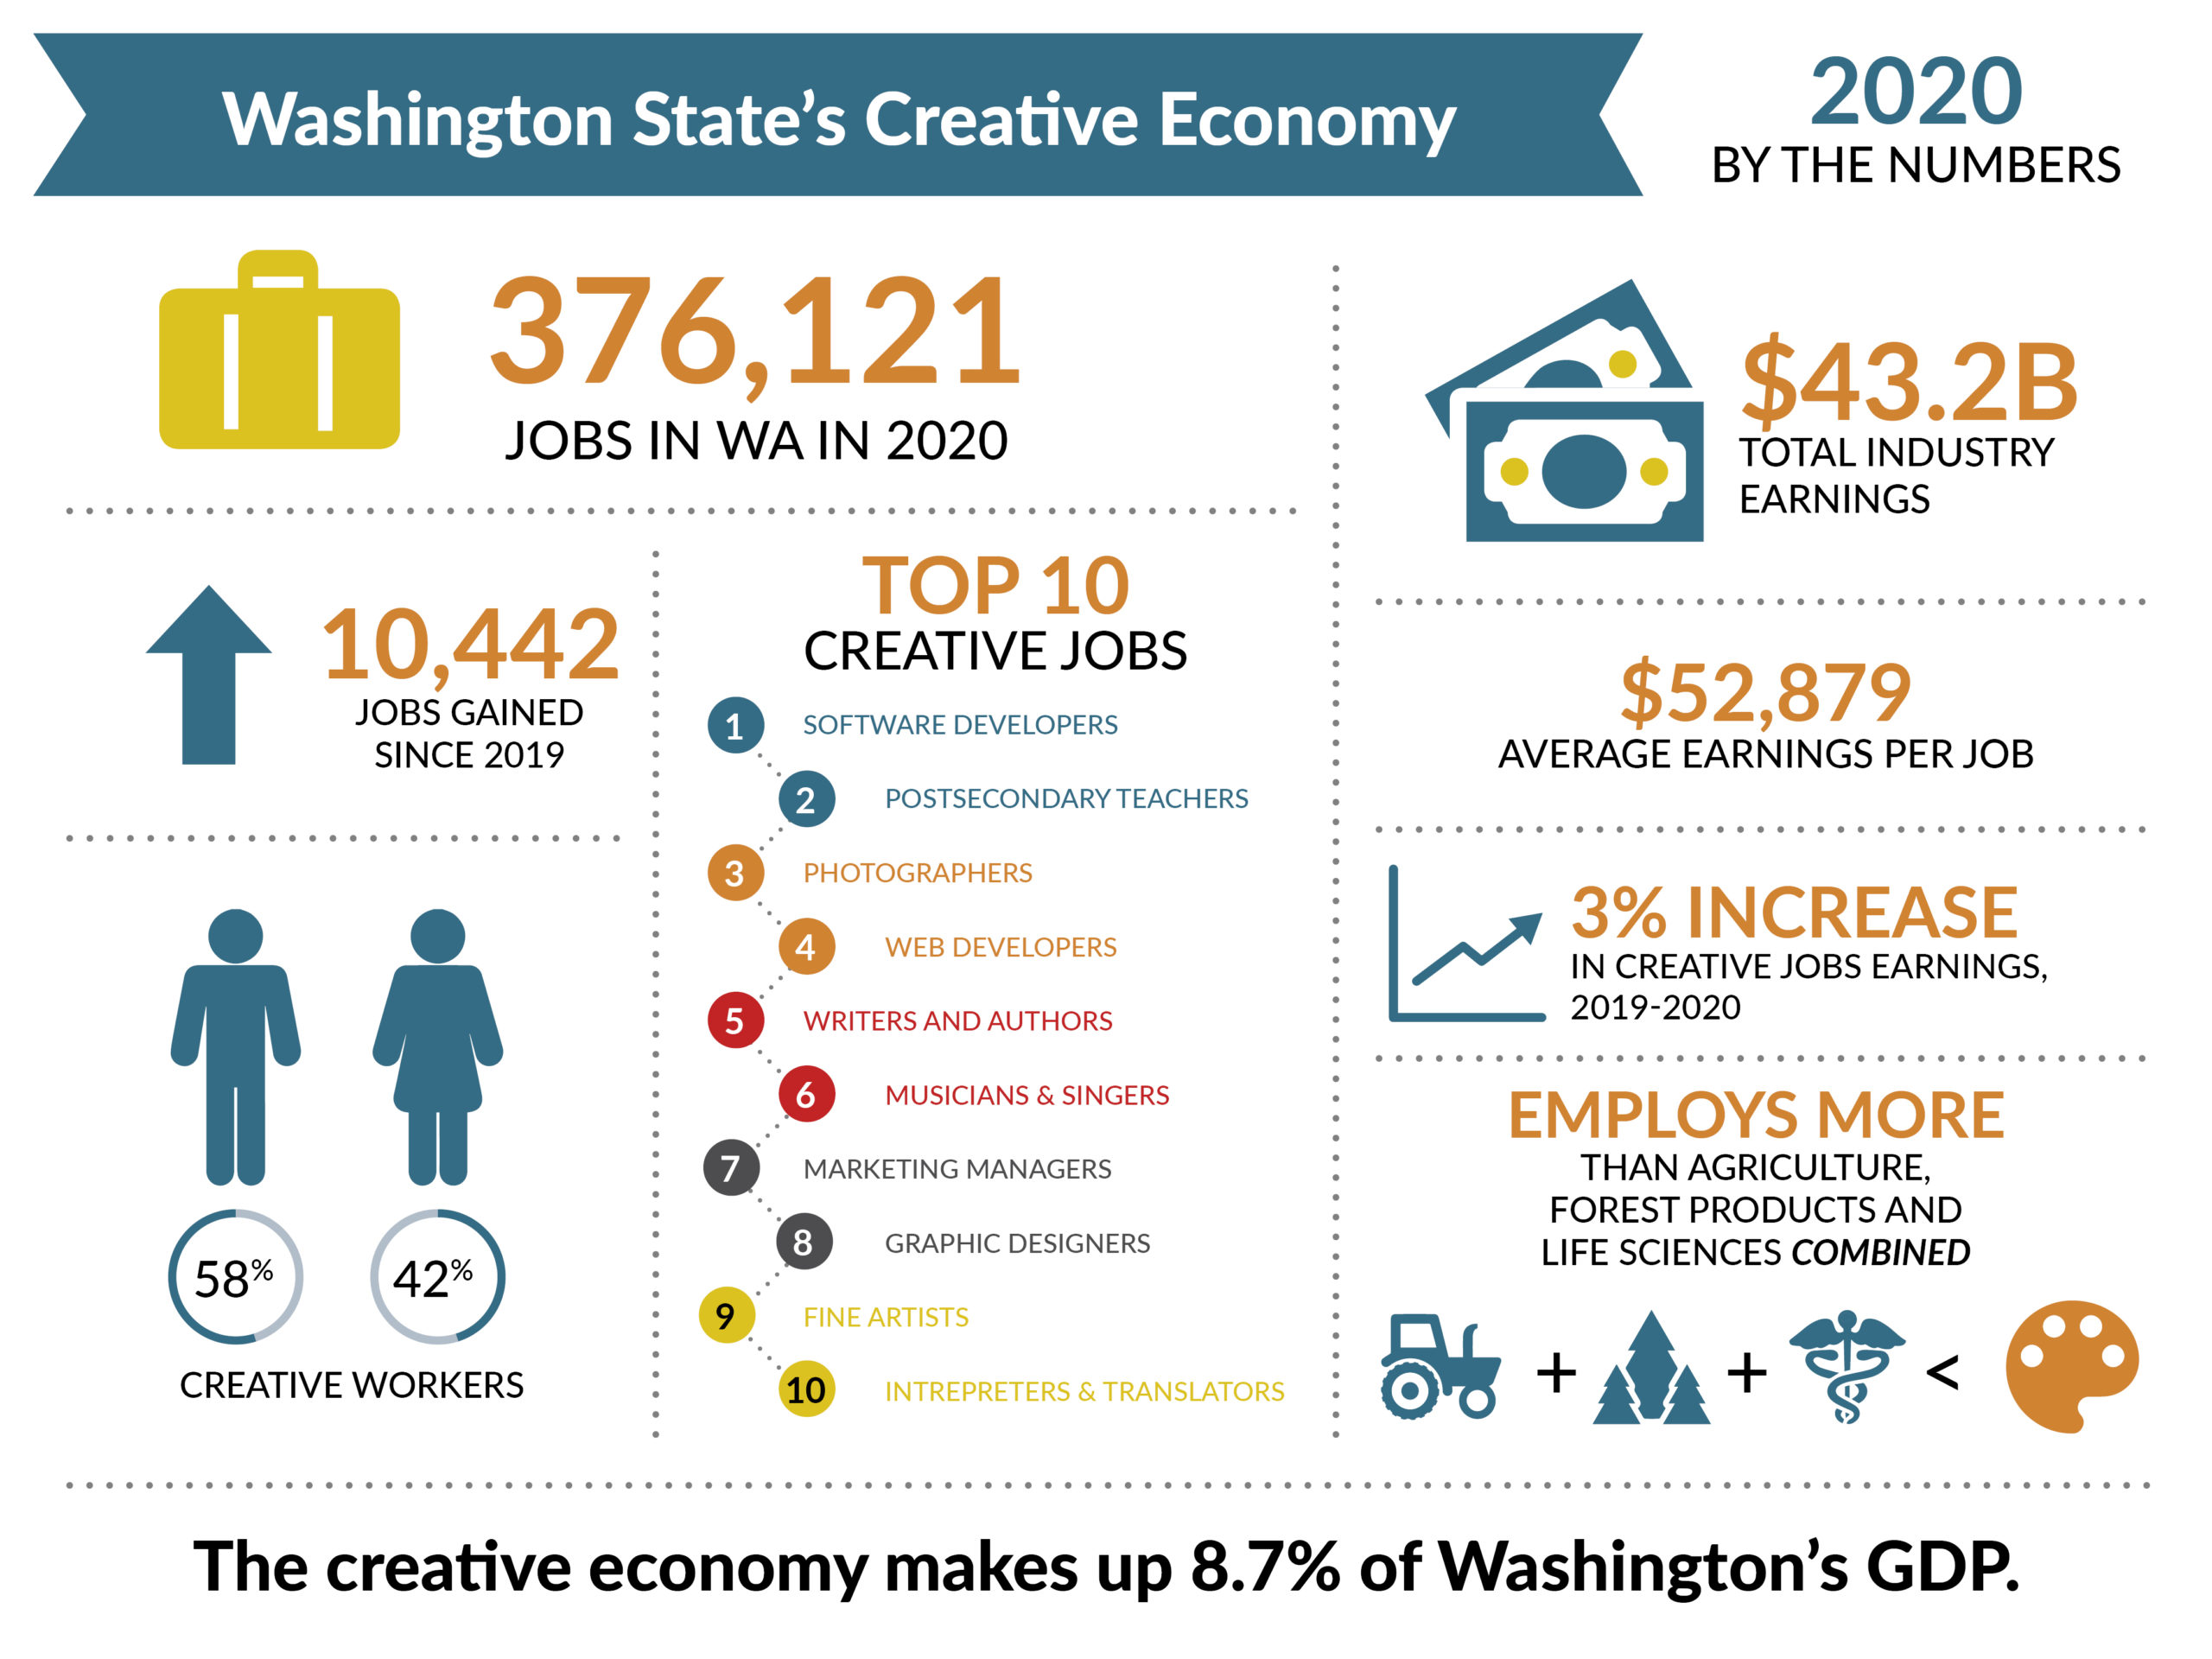
How do we track our Creative Economy?
ArtsWA tracks our creative economy using a data tool called the Creative Vitality Suite (CVSuite). This tool lets us measure the annual health of the state’s creative economy by zip code and county. The CVSuite tracks the following information:
- Creative sectors and industries
- Jobs that make up the creative sector
- Wages and revenues
- Non-profit arts organization revenue
The CVSuite gathers all of this information into an overall score. This score, called the Creative Vitality Index (CVI), lets us compare the health of our creative economy to other regions. A score of 1.0 is the U.S. average.
How can your community use this data?
Use this data to learn what types of jobs and creative businesses exist in your local economy. It can inform public policies to support and grow the creative sector. It can also inform economic development strategies to attract new businesses to your region.
For questions about the Creative Vitality of your region (Washington residents only), contact Michael Wallenfels.
Data Sources
The Western States Arts Federation (WESTAF) developed the CVSuite. They gather and present data from a number of sources and partners. Their partners include:
- Economic Modeling Specialist International (EMSI)
- National Center of Charitable Statistics (NCCS)
- National Assembly of State Arts Agencies (NASAA)
In 2011 and 2013, ArtsWA funded several Creative Vitality pilot projects in local communities. Regional partnerships received $1,000 and training on the CVSuite data. Lori Pfingst, PhD, Senior Policy Analyst with the Washington State Budget & Policy Center mentored these partners. Below are brief summaries for eight funded projects.
- Artist Trust partnered with Seattle University. They researched how artists impact arts ecosystems. Read their Final report.
- Arts of Clark County partnered with the Clark County Arts Commission. They researched the creative economy in Clark County. They used their findings in presentations and brochures for community leaders. Read their Final report. View their Project publication.
- Allied Arts of Whatcom County partnered with the Bellingham Public Development Authority, Bellingham Tourism Bureau, and City of Bellingham. They researched the importance of the arts in Whatcom County. Read their Final report. View their Project publication.
- Kirkland Arts Center partnered with the cities of Redmond, Kirkland, and Bellevue. They assessed the creative economy in King County’s Eastside. Read their Final report.
- Renton Municipal Arts Commission partnered with the City of Renton, Renton Technical College, Renton Chamber of Commerce, and Renton History Museum. They increased public awareness about the impact of creative businesses in Renton. Read their Final report.
- Richland Arts Foundation partnered with Richland Arts Commission, Kennewick Arts Commission, Port of Kennewick, Rivers of Ink, Art Center Task Force, Tri-City Visitor and Convention Bureau, and the City of Richland. They raised public awareness of Tri-Cities arts availability and benefits. Read their Final report.
- San Juan County Arts Council partnered with the San Juan Islands Visitors Bureau and the San Juan County Economic Development Council. Their research showed the strength of the creative economy in San Juan County. Their project helped the Arts Council establish itself as a credible and collaborative leader. Read their Final report. View their Project publication.
- Thurston Economic Development Council partnered with the Olympia Lacey Tumwater Visitor and Convention Bureau, Thurston Chamber of Commerce, Saint Martin’s University, J Robertson and Company, and City of Olympia. They added creative economy data the Economic Vitality Index published annually for Thurston County. They demonstrated the arts sector’s significant impact on the region’s vitality. Read their Final report.

